|
chr6_+_105511615
|
1.679
|
NM_001004317
|
LIN28B
|
lin-28 homolog B (C. elegans)
|
|
chr6_-_128883125
|
1.197
|
NM_002844
NM_001135648
|
PTPRK
|
protein tyrosine phosphatase, receptor type, K
|
|
chr2_+_101680594
|
1.013
|
NM_004834
NM_145686
NM_145687
|
MAP4K4
|
mitogen-activated protein kinase kinase kinase kinase 4
|
|
chr20_-_38751289
|
0.844
|
NM_005461
|
MAFB
|
v-maf musculoaponeurotic fibrosarcoma oncogene homolog B (avian)
|
|
chr1_-_117011824
|
0.833
|
NM_001007237
NM_001542
|
IGSF3
|
immunoglobulin superfamily, member 3
|
|
chr12_+_52665196
|
0.759
|
NM_017409
|
HOXC10
|
homeobox C10
|
|
chr1_-_12599934
|
0.684
|
NM_004753
|
DHRS3
|
dehydrogenase/reductase (SDR family) member 3
|
|
chr10_-_123346148
|
0.645
|
NM_001144915
|
FGFR2
|
fibroblast growth factor receptor 2
|
|
chr17_-_37196463
|
0.642
|
NM_002230
NM_021991
|
JUP
|
junction plakoglobin
|
|
chr20_-_39680405
|
0.641
|
NM_032221
|
CHD6
|
chromodomain helicase DNA binding protein 6
|
|
chr11_-_27450808
|
0.616
|
NM_018490
|
LGR4
|
leucine-rich repeat containing G protein-coupled receptor 4
|
|
chr19_+_12810258
|
0.603
|
NM_014975
|
MAST1
|
microtubule associated serine/threonine kinase 1
|
|
chr17_+_44325127
|
0.596
|
NM_001002027
NM_005175
|
ATP5G1
|
ATP synthase, H+ transporting, mitochondrial Fo complex, subunit C1 (subunit 9)
|
|
chr6_-_10523424
|
0.579
|
NM_003220
|
TFAP2A
|
transcription factor AP-2 alpha (activating enhancer binding protein 2 alpha)
|
|
chr16_-_30841938
|
0.579
|
|
NCRNA00095
|
non-protein coding RNA 95
|
|
chr6_+_132000134
|
0.576
|
NM_005021
|
ENPP3
|
ectonucleotide pyrophosphatase/phosphodiesterase 3
|
|
chr20_+_29656744
|
0.573
|
NM_002165
NM_181353
|
ID1
|
inhibitor of DNA binding 1, dominant negative helix-loop-helix protein
|
|
chr16_+_21518633
|
0.572
|
|
METTL9
|
methyltransferase like 9
|
|
chr8_-_29262240
|
0.556
|
NM_057158
|
DUSP4
|
dual specificity phosphatase 4
|
|
chr16_+_67698943
|
0.554
|
NM_005329
|
HAS3
|
hyaluronan synthase 3
|
|
chr11_-_16380967
|
0.543
|
NM_001145819
NM_017508
|
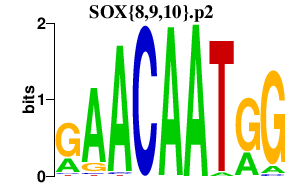
SOX6
|
SRY (sex determining region Y)-box 6
|
|
chr1_+_154855709
|
0.535
|
NM_021817
|
HAPLN2
|
hyaluronan and proteoglycan link protein 2
|
|
chr7_+_121300394
|
0.534
|
NM_002851
|
PTPRZ1
|
protein tyrosine phosphatase, receptor-type, Z polypeptide 1
|
|
chr2_+_220200530
|
0.533
|
NM_005070
NM_201574
|
SLC4A3
|
solute carrier family 4, anion exchanger, member 3
|
|
chr5_-_50714836
|
0.530
|
|
LOC642366
|
hypothetical LOC642366
|
|
chr1_-_155095289
|
0.526
|
NM_014215
|
INSRR
|
insulin receptor-related receptor
|
|
chr10_-_32707549
|
0.519
|
|
EPC1
|
enhancer of polycomb homolog 1 (Drosophila)
|
|
chr14_-_89490780
|
0.517
|
NM_145231
|
EFCAB11
|
EF-hand calcium binding domain 11
|
|
chr17_-_36074812
|
0.513
|
NM_152349
|
KRT222
|
keratin 222
|
|
chr11_+_101488380
|
0.508
|
NM_001195045
|
YAP1
|
Yes-associated protein 1
|
|
chr20_+_3775421
|
0.501
|
NM_020746
|
MAVS
|
mitochondrial antiviral signaling protein
|
|
chr19_+_63482118
|
0.492
|
NM_021089
|
ZNF8
|
zinc finger protein 8
|
|
chr10_-_91451102
|
0.492
|
|
NBAS
|
neuroblastoma amplified sequence
|
|
chr12_-_23995220
|
0.474
|
|
SOX5
|
SRY (sex determining region Y)-box 5
|
|
chr12_-_23995109
|
0.472
|
|
SOX5
|
SRY (sex determining region Y)-box 5
|
|
chr1_+_93686154
|
0.471
|
NM_001024948
NM_001164473
NM_017737
|
FNBP1L
|
formin binding protein 1-like
|
|
chr17_+_16886491
|
0.468
|
NM_015134
NM_201274
|
MPRIP
|
myosin phosphatase Rho interacting protein
|
|
chr6_-_28663045
|
0.457
|
NM_052923
|
SCAND3
|
SCAN domain containing 3
|
|
chr18_+_3437607
|
0.453
|
NM_173207
|
TGIF1
|
TGFB-induced factor homeobox 1
|
|
chr16_-_30705707
|
0.449
|
NM_001080417
|
ZNF629
|
zinc finger protein 629
|
|
chr1_-_2451543
|
0.446
|
NM_001010926
|
HES5
|
hairy and enhancer of split 5 (Drosophila)
|
|
chr5_+_76047536
|
0.445
|
NM_001992
|
F2R
|
coagulation factor II (thrombin) receptor
|
|
chr1_+_64012154
|
0.441
|
NM_001083592
NM_005012
|
ROR1
|
receptor tyrosine kinase-like orphan receptor 1
|
|
chr5_+_50714996
|
0.441
|
|
ISL1
|
ISL LIM homeobox 1
|
|
chr19_-_60369731
|
0.436
|
NM_178837
|
C19orf51
|
chromosome 19 open reading frame 51
|
|
chr2_-_204108151
|
0.433
|
NM_203365
NM_213589
|
RAPH1
|
Ras association (RalGDS/AF-6) and pleckstrin homology domains 1
|
|
chr5_-_16989290
|
0.429
|
|
MYO10
|
myosin X
|
|
chr20_-_538909
|
0.427
|
NM_004609
|
TCF15
|
transcription factor 15 (basic helix-loop-helix)
|
|
chr18_-_13905534
|
0.425
|
NM_000529
|
MC2R
|
melanocortin 2 receptor (adrenocorticotropic hormone)
|
|
chr15_+_38923470
|
0.422
|
NM_003710
NM_181642
|
SPINT1
|
serine peptidase inhibitor, Kunitz type 1
|
|
chr9_-_73573121
|
0.418
|
NM_001135820
NM_013390
|
TMEM2
|
transmembrane protein 2
|
|
chr14_+_36196523
|
0.415
|
NM_006194
|
PAX9
|
paired box 9
|
|
chr14_+_23008742
|
0.407
|
|
NGDN
|
neuroguidin, EIF4E binding protein
|
|
chr16_-_19440786
|
0.405
|
NM_016641
|
GDE1
|
glycerophosphodiester phosphodiesterase 1
|
|
chr6_-_64087806
|
0.401
|
NM_001143940
NM_016571
|
LGSN
|
lengsin, lens protein with glutamine synthetase domain
|
|
chr3_-_48675321
|
0.398
|
NM_001407
|
CELSR3
|
cadherin, EGF LAG seven-pass G-type receptor 3 (flamingo homolog, Drosophila)
|
|
chr2_+_172658453
|
0.397
|
NM_001038493
NM_178120
|
DLX1
|
distal-less homeobox 1
|
|
chr6_+_83129641
|
0.397
|
NM_006670
|
TPBG
|
trophoblast glycoprotein
|
|
chr1_+_158636987
|
0.395
|
NM_020335
|
VANGL2
|
vang-like 2 (van gogh, Drosophila)
|
|
chr1_+_200449905
|
0.384
|
NM_001017404
|
LGR6
|
leucine-rich repeat containing G protein-coupled receptor 6
|
|
chr2_-_37752272
|
0.381
|
|
CDC42EP3
|
CDC42 effector protein (Rho GTPase binding) 3
|
|
chr14_+_23008723
|
0.374
|
NM_001042635
NM_015514
|
NGDN
|
neuroguidin, EIF4E binding protein
|
|
chr2_+_74539039
|
0.373
|
NM_012477
|
WBP1
|
WW domain binding protein 1
|
|
chr11_-_101828563
|
0.373
|
NM_052932
|
TMEM123
|
transmembrane protein 123
|
|
chr2_-_70329067
|
0.372
|
NM_022037
NM_022173
|
TIA1
|
TIA1 cytotoxic granule-associated RNA binding protein
|
|
chr18_+_3584056
|
0.371
|
|
FLJ35776
|
hypothetical LOC649446
|
|
chr19_+_17440577
|
0.368
|
|
SLC27A1
|
solute carrier family 27 (fatty acid transporter), member 1
|
|
chr6_-_42218692
|
0.367
|
NM_001164446
|
C6orf132
|
chromosome 6 open reading frame 132
|
|
chr18_+_3441589
|
0.366
|
NM_170695
NM_173210
|
TGIF1
|
TGFB-induced factor homeobox 1
|
|
chr20_+_16676997
|
0.363
|
NM_020157
|
OTOR
|
otoraplin
|
|
chr10_-_115924353
|
0.359
|
NM_018017
|
C10orf118
|
chromosome 10 open reading frame 118
|
|
chr10_+_124885556
|
0.358
|
NM_001105574
|
HMX3
|
H6 family homeobox 3
|
|
chr14_-_90953883
|
0.358
|
NM_001080414
|
CCDC88C
|
coiled-coil domain containing 88C
|
|
chr15_+_38923914
|
0.358
|
NM_001032367
|
SPINT1
|
serine peptidase inhibitor, Kunitz type 1
|
|
chr20_+_20296744
|
0.357
|
NM_002196
|
INSM1
|
insulinoma-associated 1
|
|
chr22_+_38652555
|
0.355
|
|
GRAP2
|
GRB2-related adaptor protein 2
|
|
chr11_-_57173823
|
0.354
|
NM_145008
|
YPEL4
|
yippee-like 4 (Drosophila)
|
|
chr14_+_38714111
|
0.353
|
NM_002687
|
PNN
|
pinin, desmosome associated protein
|
|
chr6_+_30796064
|
0.352
|
|
TUBB
|
tubulin, beta
|
|
chr5_+_50714714
|
0.350
|
NM_002202
|
ISL1
|
ISL LIM homeobox 1
|
|
chr6_-_80303822
|
0.350
|
NM_001122769
NM_181714
|
LCA5
|
Leber congenital amaurosis 5
|
|
chr3_+_51397731
|
0.344
|
NM_006010
|
MANF
|
mesencephalic astrocyte-derived neurotrophic factor
|
|
chr9_+_19398924
|
0.343
|
NM_001010887
|
ACER2
|
alkaline ceramidase 2
|
|
chr3_-_150422474
|
0.341
|
NM_000096
|
CP
|
ceruloplasmin (ferroxidase)
|
|
chr14_-_54948290
|
0.341
|
NM_014924
|
ATG14
|
ATG14 autophagy related 14 homolog (S. cerevisiae)
|
|
chr13_+_28900776
|
0.338
|
NM_015233
|
MTUS2
|
microtubule associated tumor suppressor candidate 2
|
|
chr22_+_37193961
|
0.331
|
NM_006855
NM_016657
|
KDELR3
|
KDEL (Lys-Asp-Glu-Leu) endoplasmic reticulum protein retention receptor 3
|
|
chr1_-_16411690
|
0.331
|
NM_153213
|
ARHGEF19
|
Rho guanine nucleotide exchange factor (GEF) 19
|
|
chr14_+_58725104
|
0.329
|
NM_014992
|
DAAM1
|
dishevelled associated activator of morphogenesis 1
|
|
chr9_-_32540818
|
0.326
|
|
TOPORS
|
topoisomerase I binding, arginine/serine-rich, E3 ubiquitin protein ligase
|
|
chr13_+_51927615
|
0.325
|
|
CKAP2
|
cytoskeleton associated protein 2
|
|
chr9_+_22103542
|
0.323
|
|
CDKN2B-AS1
|
CDKN2B antisense RNA 1 (non-protein coding)
|
|
chr5_-_16989371
|
0.322
|
NM_012334
|
MYO10
|
myosin X
|
|
chr8_+_79740813
|
0.322
|
NM_016010
|
FAM164A
|
family with sequence similarity 164, member A
|
|
chr4_+_74491272
|
0.320
|
|
ALB
|
albumin
|
|
chr2_+_223244606
|
0.317
|
NM_058165
|
MOGAT1
|
monoacylglycerol O-acyltransferase 1
|
|
chr5_+_40877053
|
0.315
|
NM_032587
|
CARD6
|
caspase recruitment domain family, member 6
|
|
chr12_-_80677223
|
0.313
|
NM_003625
|
PPFIA2
|
protein tyrosine phosphatase, receptor type, f polypeptide (PTPRF), interacting protein (liprin), alpha 2
|
|
chr20_-_21326046
|
0.309
|
NM_033176
|
NKX2-4
|
NK2 homeobox 4
|
|
chr8_+_70541412
|
0.308
|
NM_001128204
NM_015170
|
SULF1
|
sulfatase 1
|
|
chr11_-_14870326
|
0.304
|
NM_024514
|
CYP2R1
|
cytochrome P450, family 2, subfamily R, polypeptide 1
|
|
chr3_-_129777618
|
0.304
|
NM_007354
|
C3orf27
|
chromosome 3 open reading frame 27
|
|
chr2_-_151052391
|
0.304
|
NM_005168
|
RND3
|
Rho family GTPase 3
|
|
chr10_+_91451313
|
0.303
|
NM_016195
|
KIF20B
|
kinesin family member 20B
|
|
chr3_+_142143329
|
0.303
|
NM_001104647
NM_018155
|
SLC25A36
|
solute carrier family 25, member 36
|
|
chr6_-_10523203
|
0.301
|
|
TFAP2A
|
transcription factor AP-2 alpha (activating enhancer binding protein 2 alpha)
|
|
chr6_-_130578110
|
0.300
|
NM_152552
|
SAMD3
|
sterile alpha motif domain containing 3
|
|
chr3_+_85090721
|
0.297
|
NM_001167674
NM_001167675
|
CADM2
|
cell adhesion molecule 2
|
|
chr21_-_18113514
|
0.297
|
NM_001100420
NM_001100421
NM_017447
|
C21orf91
|
chromosome 21 open reading frame 91
|
|
chr1_+_29113589
|
0.297
|
NM_001166006
|
EPB41
|
erythrocyte membrane protein band 4.1 (elliptocytosis 1, RH-linked)
|
|
chr16_-_24934151
|
0.297
|
NM_001006634
NM_018054
|
ARHGAP17
|
Rho GTPase activating protein 17
|
|
chr17_-_46298671
|
0.296
|
|
TOB1
|
transducer of ERBB2, 1
|
|
chr17_-_40380553
|
0.293
|
NM_001080443
|
KIF18B
|
kinesin family member 18B
|
|
chr2_+_12775814
|
0.292
|
|
|
|
|
chr14_-_64638809
|
0.290
|
|
MAX
|
MYC associated factor X
|
|
chr2_+_62787534
|
0.290
|
NM_001142614
|
EHBP1
|
EH domain binding protein 1
|
|
chr6_+_50894397
|
0.289
|
NM_003221
|
TFAP2B
|
transcription factor AP-2 beta (activating enhancer binding protein 2 beta)
|
|
chr3_+_51397756
|
0.289
|
|
MANF
|
mesencephalic astrocyte-derived neurotrophic factor
|
|
chr12_-_102413875
|
0.288
|
NM_198521
NM_001099336
|
C12orf42
|
chromosome 12 open reading frame 42
|
|
chr9_+_4782833
|
0.288
|
NM_005772
|
RCL1
|
RNA terminal phosphate cyclase-like 1
|
|
chr8_+_70541631
|
0.285
|
|
SULF1
|
sulfatase 1
|
|
chr2_+_201755865
|
0.284
|
NM_001230
NM_032974
NM_032977
|
CASP10
|
caspase 10, apoptosis-related cysteine peptidase
|
|
chr2_-_201536425
|
0.281
|
NM_006190
|
ORC2
|
origin recognition complex, subunit 2
|
|
chr14_-_30746577
|
0.280
|
|
|
|
|
chr3_-_107070400
|
0.278
|
NM_170662
|
CBLB
|
Cas-Br-M (murine) ecotropic retroviral transforming sequence b
|
|
chr3_+_195336625
|
0.278
|
NM_005524
|
HES1
|
hairy and enhancer of split 1, (Drosophila)
|
|
chr2_+_220017617
|
0.277
|
|
SPEG
|
SPEG complex locus
|
|
chr14_-_19871267
|
0.276
|
NM_021178
NM_182849
|
CCNB1IP1
|
cyclin B1 interacting protein 1, E3 ubiquitin protein ligase
|
|
chr14_-_30565275
|
0.275
|
NM_001083893
NM_014574
|
STRN3
|
striatin, calmodulin binding protein 3
|
|
chr15_-_62460622
|
0.271
|
NM_001029989
NM_014736
|
KIAA0101
|
KIAA0101
|
|
chr3_+_112743729
|
0.271
|
|
CD96
|
CD96 molecule
|
|
chr8_-_22044463
|
0.270
|
NM_005144
NM_018411
|
HR
|
hairless homolog (mouse)
|
|
chr1_-_152431175
|
0.270
|
NM_152263
|
TPM3
|
tropomyosin 3
|
|
chr2_-_164300758
|
0.269
|
NM_018086
|
FIGN
|
fidgetin
|
|
chr2_+_17923404
|
0.269
|
NM_002252
|
KCNS3
|
potassium voltage-gated channel, delayed-rectifier, subfamily S, member 3
|
|
chr4_+_119174947
|
0.268
|
NM_004784
|
NDST3
|
N-deacetylase/N-sulfotransferase (heparan glucosaminyl) 3
|
|
chr17_+_75366524
|
0.267
|
NM_005189
NM_032647
|
CBX2
|
chromobox homolog 2
|
|
chr3_-_49117169
|
0.266
|
NM_005051
|
QARS
|
glutaminyl-tRNA synthetase
|
|
chr8_+_102573837
|
0.266
|
NM_024915
|
GRHL2
|
grainyhead-like 2 (Drosophila)
|
|
chr2_+_190981257
|
0.264
|
NM_017694
|
MFSD6
|
major facilitator superfamily domain containing 6
|
|
chr17_-_76985538
|
0.263
|
|
|
|
|
chr6_+_30796121
|
0.263
|
|
TUBB
|
tubulin, beta
|
|
chr5_-_41546384
|
0.262
|
NM_001005473
|
PLCXD3
|
phosphatidylinositol-specific phospholipase C, X domain containing 3
|
|
chr12_-_97812633
|
0.262
|
|
ANKS1B
|
ankyrin repeat and sterile alpha motif domain containing 1B
|
|
chr3_-_88190737
|
0.260
|
NM_001008390
NM_003663
|
CGGBP1
|
CGG triplet repeat binding protein 1
|
|
chr9_-_138778780
|
0.260
|
NM_203347
|
LCN15
|
lipocalin 15
|
|
chr10_-_105982052
|
0.259
|
NM_025145
|
WDR96
|
WD repeat domain 96
|
|
chr14_-_70345485
|
0.257
|
NM_033141
|
MAP3K9
|
mitogen-activated protein kinase kinase kinase 9
|
|
chr12_-_61283474
|
0.256
|
NM_175895
|
C12orf61
|
chromosome 12 open reading frame 61
|
|
chr5_+_140709907
|
0.256
|
NM_018922
NM_032095
|
PCDHGB1
|
protocadherin gamma subfamily B, 1
|
|
chr14_+_62740878
|
0.256
|
NM_020663
|
RHOJ
|
ras homolog gene family, member J
|
|
chr5_+_170668892
|
0.255
|
NM_021025
|
TLX3
|
T-cell leukemia homeobox 3
|
|
chr9_+_80101810
|
0.252
|
NM_021154
NM_058179
|
PSAT1
|
phosphoserine aminotransferase 1
|
|
chr10_-_99084417
|
0.251
|
NM_012083
|
FRAT2
|
frequently rearranged in advanced T-cell lymphomas 2
|
|
chr11_-_78829342
|
0.248
|
NM_001098816
|
ODZ4
|
odz, odd Oz/ten-m homolog 4 (Drosophila)
|
|
chr6_+_30796123
|
0.247
|
NM_178014
|
TUBB
|
tubulin, beta
|
|
chr2_-_128285214
|
0.246
|
NM_001006622
NM_001006623
NM_018383
|
WDR33
|
WD repeat domain 33
|
|
chr3_-_198509808
|
0.246
|
NM_001098424
NM_004087
|
DLG1
|
discs, large homolog 1 (Drosophila)
|
|
chr7_-_27171673
|
0.245
|
NM_152739
|
HOXA9
|
homeobox A9
|
|
chr7_-_92686773
|
0.243
|
NM_198151
|
HEPACAM2
|
HEPACAM family member 2
|
|
chr3_-_101077605
|
0.243
|
NM_014890
|
FILIP1L
|
filamin A interacting protein 1-like
|
|
chrX_+_152565849
|
0.242
|
|
DUSP9
|
dual specificity phosphatase 9
|
|
chr20_+_1132097
|
0.242
|
NM_001009612
|
C20orf202
|
chromosome 20 open reading frame 202
|
|
chr6_-_2785682
|
0.242
|
|
SERPINB1
|
serpin peptidase inhibitor, clade B (ovalbumin), member 1
|
|
chr16_-_52877829
|
0.239
|
|
IRX3
|
iroquois homeobox 3
|
|
chr20_+_10363949
|
0.238
|
NM_001009608
|
C20orf94
|
chromosome 20 open reading frame 94
|
|
chr19_-_6718417
|
0.238
|
NM_005490
|
SH2D3A
|
SH2 domain containing 3A
|
|
chr14_-_63830830
|
0.238
|
NM_001040275
NM_001437
|
ESR2
|
estrogen receptor 2 (ER beta)
|
|
chr21_-_33935883
|
0.237
|
NM_145858
|
CRYZL1
|
crystallin, zeta (quinone reductase)-like 1
|
|
chr7_-_27171648
|
0.236
|
|
HOXA9
|
homeobox A9
|
|
chr1_+_226404037
|
0.236
|
NM_020435
|
GJC2
|
gap junction protein, gamma 2, 47kDa
|
|
chr6_-_116681863
|
0.235
|
NM_021648
|
TSPYL4
|
TSPY-like 4
|
|
chr2_-_119322228
|
0.234
|
NM_001426
|
EN1
|
engrailed homeobox 1
|
|
chr20_-_13567529
|
0.233
|
NM_017714
|
TASP1
|
taspase, threonine aspartase, 1
|
|
chr3_+_188131209
|
0.233
|
|
ST6GAL1
|
ST6 beta-galactosamide alpha-2,6-sialyltranferase 1
|
|
chr14_-_20807346
|
0.232
|
NM_001077442
NM_001077443
NM_004500
NM_031314
|
HNRNPC
|
heterogeneous nuclear ribonucleoprotein C (C1/C2)
|
|
chr10_-_134449467
|
0.231
|
NM_177400
|
NKX6-2
|
NK6 homeobox 2
|
|
chr1_+_85819004
|
0.231
|
NM_001554
|
CYR61
|
cysteine-rich, angiogenic inducer, 61
|
|
chr7_-_92693716
|
0.231
|
NM_001039372
|
HEPACAM2
|
HEPACAM family member 2
|
|
chr16_+_81218142
|
0.228
|
|
CDH13
|
cadherin 13, H-cadherin (heart)
|
|
chr9_+_4782974
|
0.228
|
|
RCL1
|
RNA terminal phosphate cyclase-like 1
|
|
chr12_-_69289889
|
0.226
|
NM_002837
|
PTPRB
|
protein tyrosine phosphatase, receptor type, B
|
|
chr17_+_71095733
|
0.226
|
|
MYO15B
|
myosin XVB pseudogene
|
|
chr11_+_22316242
|
0.225
|
NM_020346
|
SLC17A6
|
solute carrier family 17 (sodium-dependent inorganic phosphate cotransporter), member 6
|
|
chr5_-_88004891
|
0.224
|
|
LOC645323
|
hypothetical LOC645323
|
|
chr4_-_101658094
|
0.224
|
NM_001159694
NM_016242
|
EMCN
|
endomucin
|
|
chr9_-_74757735
|
0.221
|
NM_000689
|
ALDH1A1
|
aldehyde dehydrogenase 1 family, member A1
|
|
chr20_-_42457717
|
0.221
|
|
|
|
|
chr16_+_24459173
|
0.220
|
|
RBBP6
|
retinoblastoma binding protein 6
|
|
chr2_+_198377561
|
0.220
|
NM_006226
|
PLCL1
|
phospholipase C-like 1
|
|
chr2_-_128285136
|
0.219
|
|
WDR33
|
WD repeat domain 33
|
|
chr20_-_33793286
|
0.219
|
|
RBM39
|
RNA binding motif protein 39
|
|
chr3_-_27739201
|
0.218
|
|
EOMES
|
eomesodermin
|
|
chrX_+_15428820
|
0.218
|
NM_203281
|
BMX
|
BMX non-receptor tyrosine kinase
|
|
chr5_-_134899537
|
0.216
|
NM_006161
|
NEUROG1
|
neurogenin 1
|
|
chr6_+_122762384
|
0.216
|
NM_001135564
NM_004506
|
HSF2
|
heat shock transcription factor 2
|
|
chr4_-_40211324
|
0.215
|
|
RBM47
|
RNA binding motif protein 47
|
|
chr13_+_51927495
|
0.215
|
NM_001098525
NM_018204
|
CKAP2
|
cytoskeleton associated protein 2
|
|
chr6_-_27222556
|
0.215
|
NM_080593
|
HIST1H2BK
|
histone cluster 1, H2bk
|
|
chr1_+_32512298
|
0.215
|
NM_001042771
|
LCK
|
lymphocyte-specific protein tyrosine kinase
|